Debugging in AEM
We have 2 ways of debugging in AEM.


- debug AEM using eclipse
- debug AEM from front end i.e from AEM
Debug AEM using eclipse
Step 1: Add the remote debugging JVM parameter in start.bat (Path:D:\new aem\author\crx-quickstart\bin\start.bat) as below.
::* default JVM options
if not defined CQ_JVM_OPTS set
CQ_JVM_OPTS=-Xmx1024m -XX:MaxPermSize=256M -Djava.awt.headless=true
-agentlib:jdwp=transport=dt_socket,address=30338,server=y,suspend=n
save the changes and start aem using double clicking jar file
address=30338 will open socket for us you can change port number.
------------------------------------------------------OR-------------------------------------------------------
Start aem using below command
To run this command go to folder where your aem jar file resides, open command prompt and run below command.
Make sure you are same jar file name in command and folder.
java -Xmx1024M -agentlib:jdwp=transport=dt_socket,address=30338,server=y,suspend=n -jar aem6.3-author-4502.jar
This command will start aem and also will open socket at address=30338 so using that address we can open debugging session in eclipse.
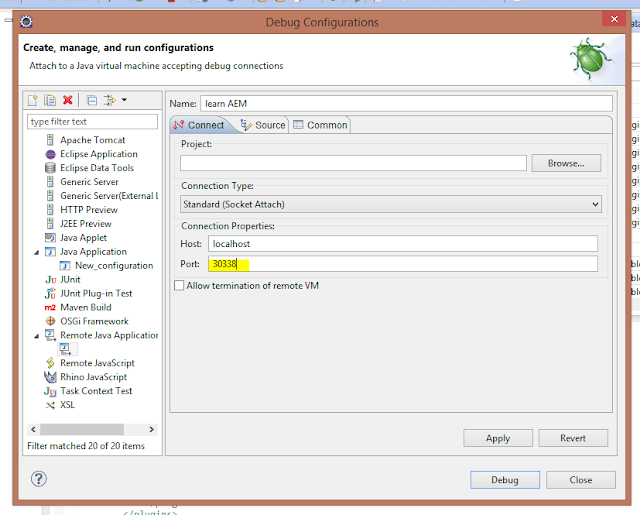
Step 2: Start debugging session in eclipse
- Open eclipse
- Go to run --> debug configuration
- double click on remote java application and add the name and port details

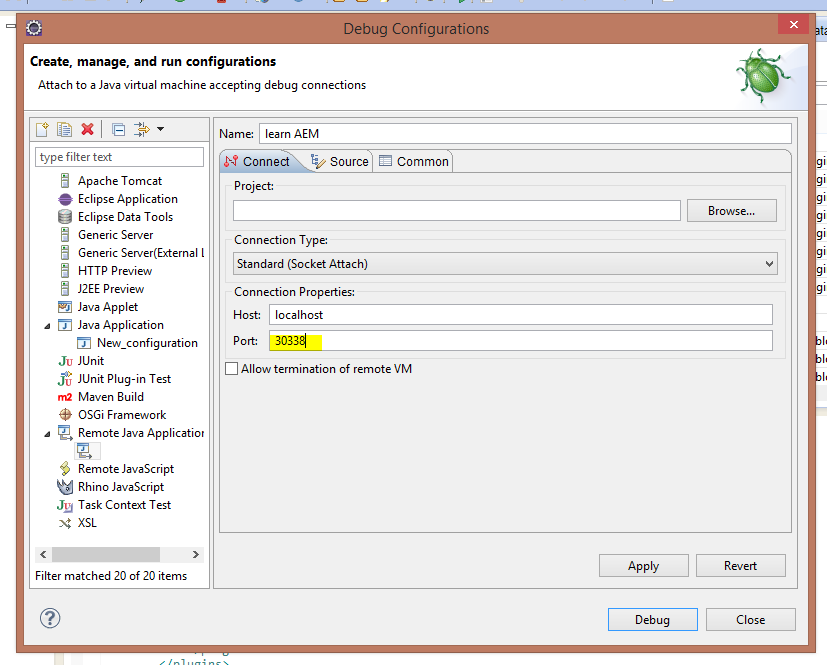
- make sure you are using the port number which is given in start.bat file command
- click apply and debug it will start debugging
- for next time just double click on your configuration to start aem in debug mode
if you don't want to do change in start.bat file you can start aem in debug mode using command prompt.
- go to your author folder
- open command prompt
- run the below command
java -jar aem6.3-author-4502.jar -fork -forkargs -- -Xdebug -Xrunjdwp:transport=dt_socket,address=30338,suspend=n,server=y -Xmx1520m -XX:MaxPermSize=512m -XX:-UseSplitVerifier

Make sure your jar file name given in command is same as your aem jar file name in author folder, after this start debugging session in eclipse as explain in step 2.
Debug AEM from front end i.e from AEM
To debug aem from front end
- Add the query parameter debugClientLibs=true in url it will return all the individual files which are included in client library
- inspect page
- go to source tab and open the required file
- add breakpoints in file under source tab and start debugging
KEEP EDUCATING YOURSELF!!!

Comments
Post a Comment